What is Kymira?
Installable skills and two
reference libraries for the agent you already run, Claude Code or Cursor. They teach it to
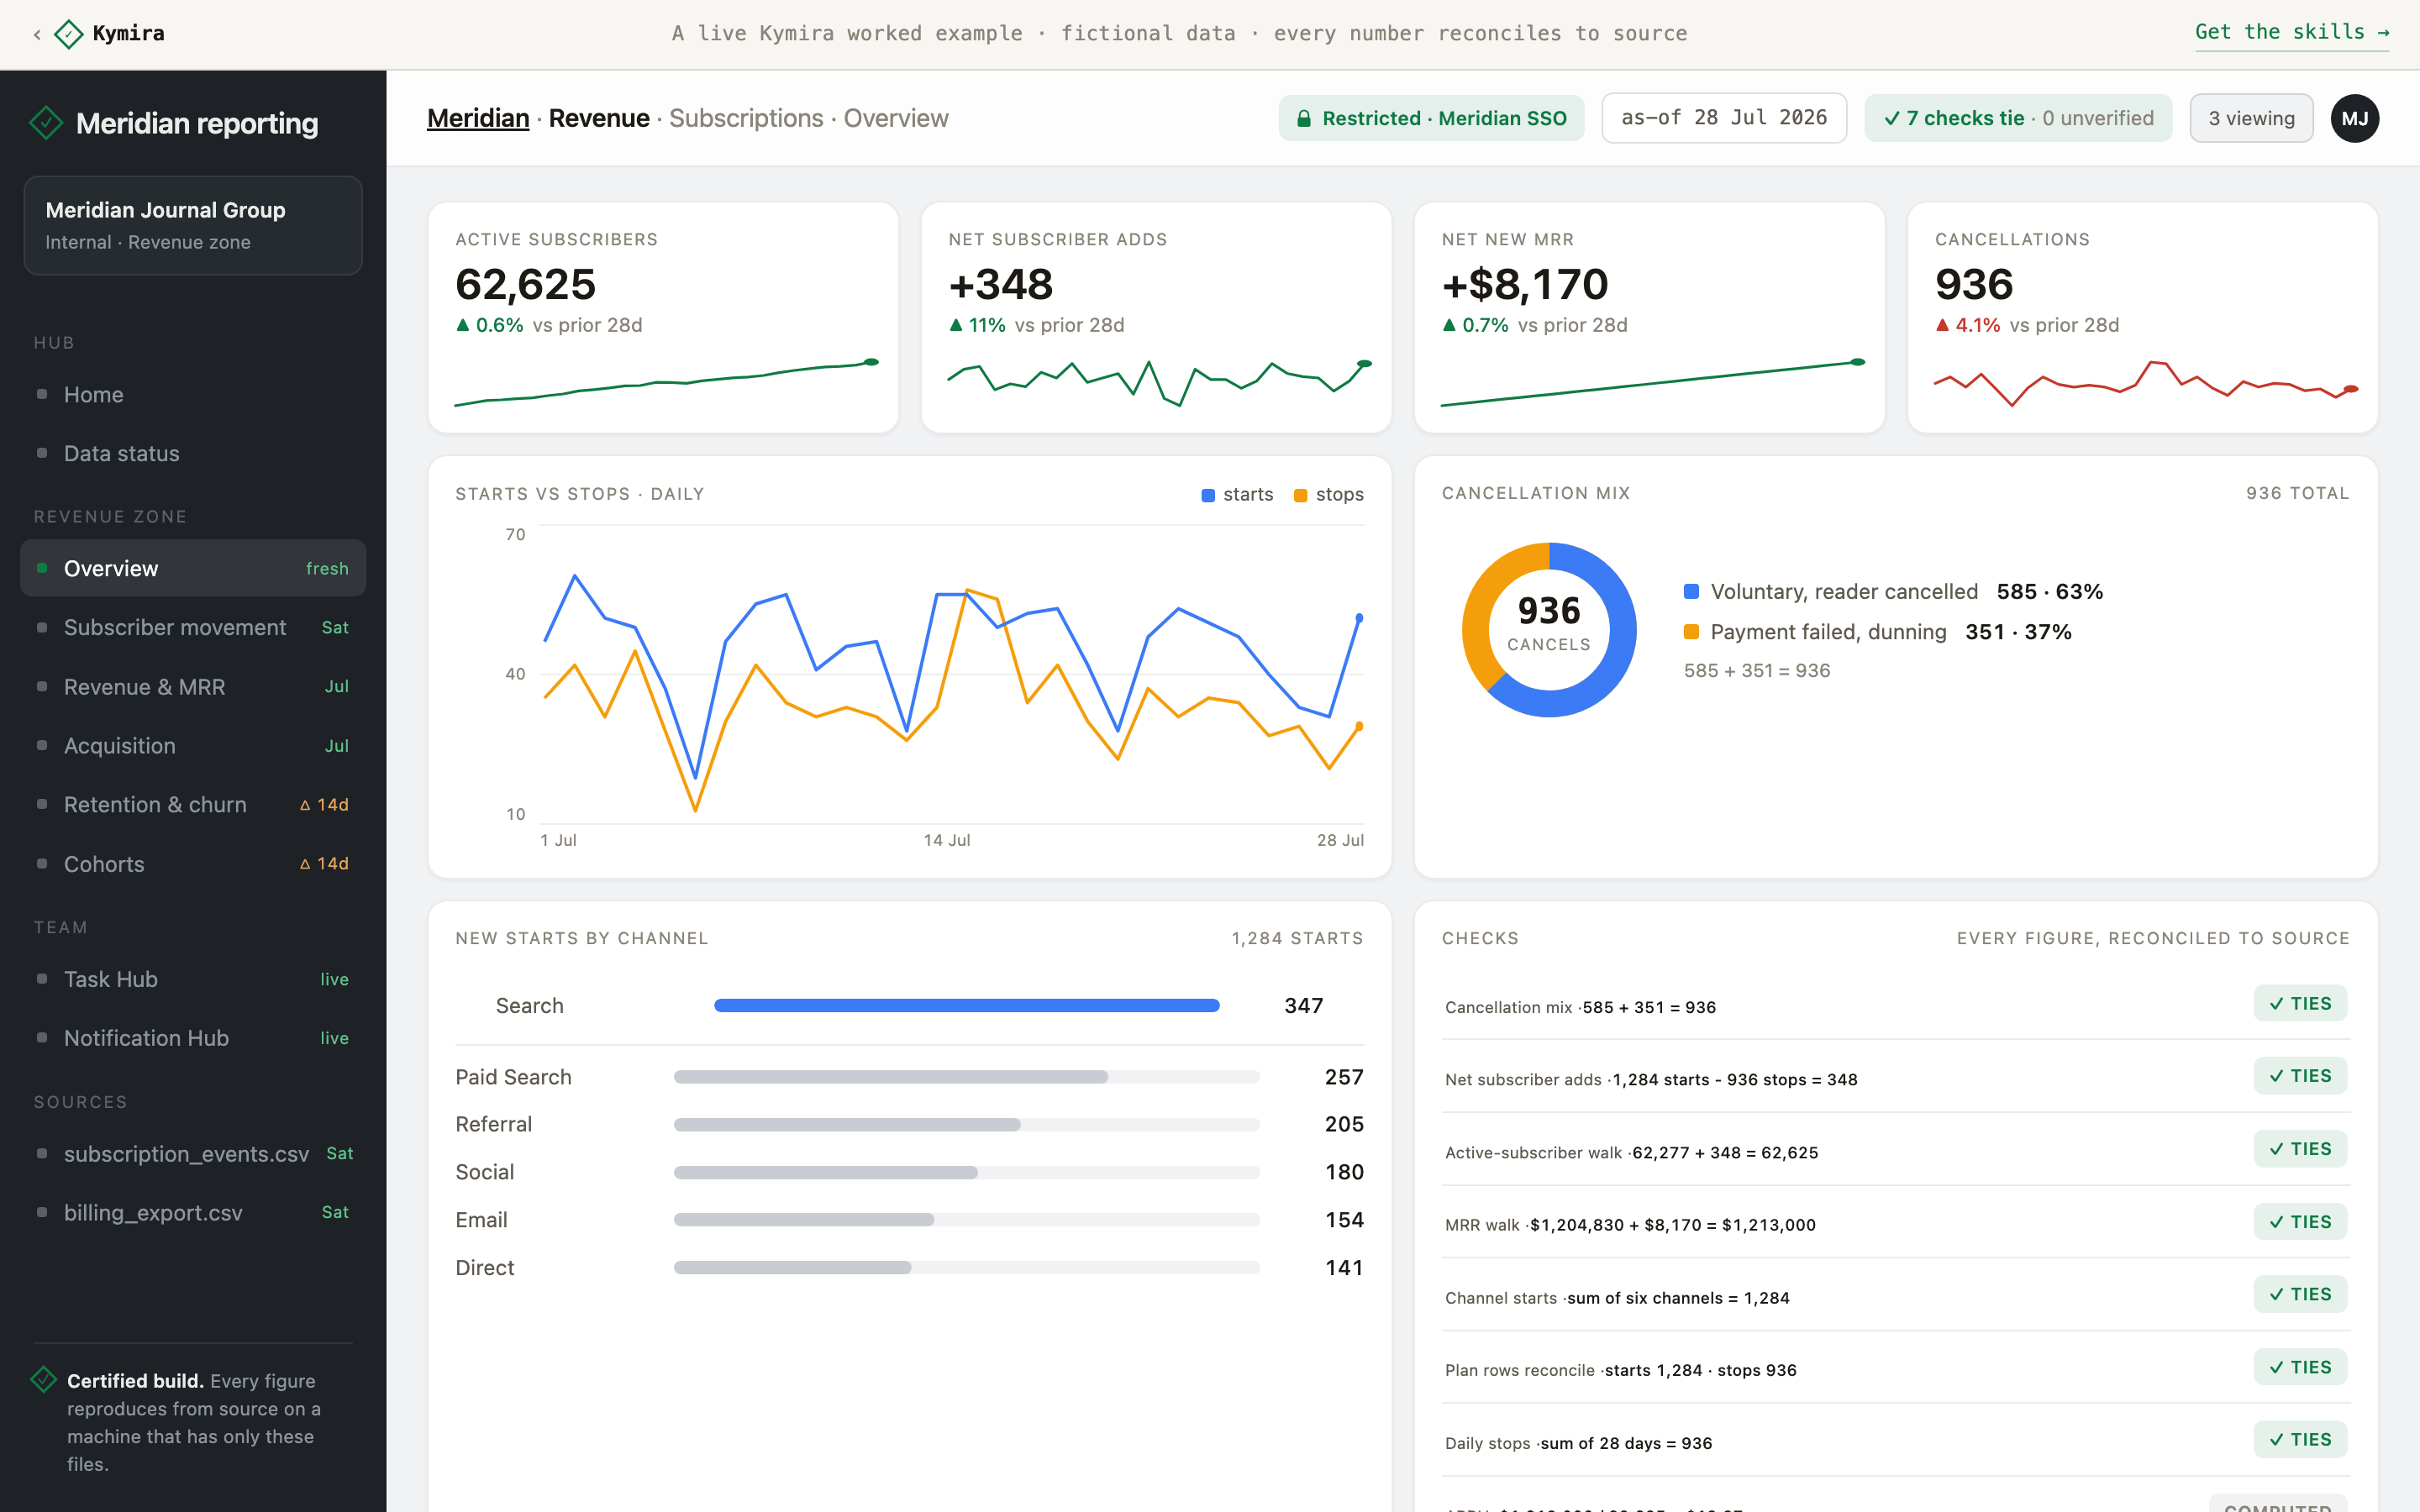
turn raw exports into business intelligence where every number reconciles to the file's own
totals, and anything it cannot prove is caught before it ships.
How is this different from Datarails, Cube, or Vena?
Those
are enterprise FP&A platforms: quote-based, demo-gated, bought by the finance organization
on annual contracts. Kymira is the certified-numbers layer for the operator: $349 once,
installed into the Claude Code or Cursor you already run, producing verified reports the
same day. See the comparison.
What do the skills actually do?
Each skill
is a plain markdown playbook your agent reads before it builds a report: find what a file
asserts about itself, reconcile every figure to it, resolve the metric definitions teams
disagree on, and design a dashboard that reads at a glance. Plus the skills that turn your
reports into a secure internal platform, with maps, exports, delivery, alerts, decks,
annotations, and the metric store. Twenty-two skills in all. For what this is actually
like, day by day, read your first week.
How do I install a skill?
Copy the skill's
folder into your agent's skills directory, ~/.claude/skills/ for Claude Code, or
the generated AGENTS.md rule for other agents, and start a fresh session. There is no build
step, a skill is just files. Paid packs also ship the kymira CLI: one command
to install, check status, and pull updates.
What is in the Metric and Format libraries?
The
Metric Library has 351 metric definitions across twelve departments, each naming the
competing definitions teams argue over (the fork) and how the number lies in real exports
(the trap). The Format Library maps 47 vendor export shapes, Stripe, QuickBooks, Shopify,
Salesforce, GA4 and more, with the structural traps in each and the anchor that reconciles
it.
Do I own the skills, or is it a subscription?
You
own them. Every paid tier is a one-time purchase with lifetime updates, no subscription. The
files are plain text with no copy protection: read them, edit them, keep them.
Can you build it for me?
Yes. Built for you
is a founder-led engagement: the engineer behind the engine builds a custom, certified BI
site on your real exports. It is by application, priced on the scope.
Where does my data go?
Nowhere. The skills
are static text files that run inside your own agent, on your machine; Kymira has no server
that ever sees your exports, and the files contain no telemetry. The only network calls in
the product are the optional installer checking your license key and the optional
kymira update command fetching new skill versions; neither ever transmits your
data. The full security model is at kymira.ai/security.
Couldn't I just prompt this myself?
You can
write the sentence: always reconcile to the file's own totals, never guess. The skills are
the several hundred rules for what happens after that sentence fails: the Total row that is
also a data row, the check that cannot fire, the tolerance that absorbs the exact error it
exists to catch. Each rule was paid for by a real wrong number, which is precisely why a
one-line prompt does not contain it.
Won't a better model make this unnecessary?
The
guarantees here are process, not model behavior: reconciliation runs as code your agent
writes and re-runs, and gates that fail closed cannot be talked out of by a smarter model,
because they are not requests to the model. And most of the content is facts about vendor
files and your own definitions, which no model upgrade supplies: a better model still does
not know which churn definition your CFO ruled on. When models change, lifetime updates
cover the port.
What if a pack is not for me?
All sales are final, because the files are plain text you keep the moment they arrive.
The free skill and the full doctrine cost nothing, so judge the quality there first; each tier card
states exactly what the pack contains. Billing errors and failed deliveries are always put right.
Does it work with Cursor and other agents?
Yes.
Every skill ships in four formats: the Claude Code skill folder, a Cursor rule file for
.cursor/rules/, an AGENTS.md variant, and a plain prompt for any other agent.
The install guide covers each.
Can I upgrade from Core to Everything later?
Yes.
Upgrading is the same motion as updating: get the Everything pack and re-run the installer,
which replaces the Core pack cleanly. Write to the support address for the upgrade price;
you pay the difference, not twice.
Is there a version that does not need a coding agent?
In build: the self-serve hosted tool, where you upload a raw export and get an
audited, certified report site with no install and no agent. The skills are the engine
behind it. Join the waitlist to be first in line.